(What I feared when I wrote this in 2014, has come to pass. Geopolitics is now discussed purely in terms of the Transnational Private Sector, and deals are made to maximise wealth and power, not to minimise human suffering. )
In the 1960s and 1970s, cold and hot wars were fought to push the idea of benevolent capitalism – believing that creation of wealth at the top of the pyramid would ‘trickle down’ and eradicate extreme poverty across the world. That did not happen.
Since the 1990s, the mantra of globalisation has been that high rates of economic growth will greatly reduce the incidence of poverty worldwide. That has not happened either.
In reality, the globalised world economy has deeply fragmented production processes, labour markets, political entities and societies, creating a plethora of interest groups and lobbies which have undermined the integrity of civil society and its rights and entitlements across the world. This is becoming increasingly visible in rich and poor countries in the form of growing disparity between places, people and groups. In particular, it is manifested in much greater income inequalities.
While a small but economically powerful section are now true global citizens and look outward for direction, the majority survive day to day, with ever reducing options and choices, pushed deeper and deeper into the world they once knew, but which is fast disappearing. The centrifugal forces of the one and the centripetal forces of the other will one day tear society apart. The cracks are already beginning to show – religious extremism, communal strife, growing racism and violence against women, more conspiracy theories and paranoia, more and more right-wing governments… The sorry stuff of headlines every day, everywhere…
An interconnected global economy has resulted not only in greater corruption and clientelism but also political capture, where the laws of the land increasingly favour the rich over the poor. (See my earlier post: The 3 Cs…)
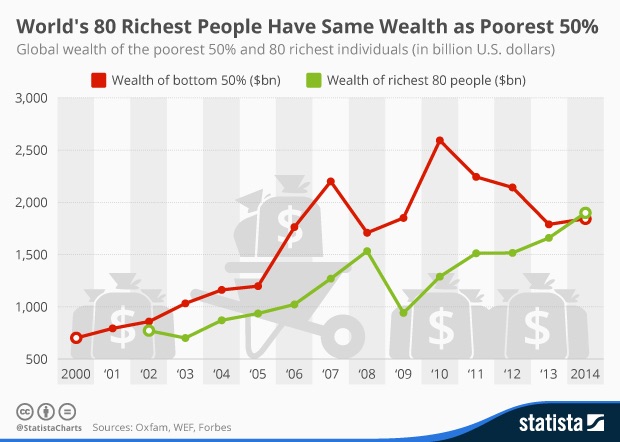
Oxfam set the cat among the pigeons when it put out the following figures:
- Almost half of the world’s wealth is now owned by just one percent of the population.
- The wealth of the one percent richest people in the world amounts to $110 trillion. That’s 65 times the total wealth of the bottom half of the world’s population, which owns the same as the richest 85 people in the world.
- Seven out of ten people live in countries where economic inequality has increased in the last 30 years.
- The richest one percent increased their share of income in 24 out of 26 countries, for which Oxfam have data, between 1980 and 2012.
- In the US, the wealthiest one percent captured 95 percent of post-financial crisis growth since 2009, while the bottom 90 percent became poorer.

Measuring Disparity
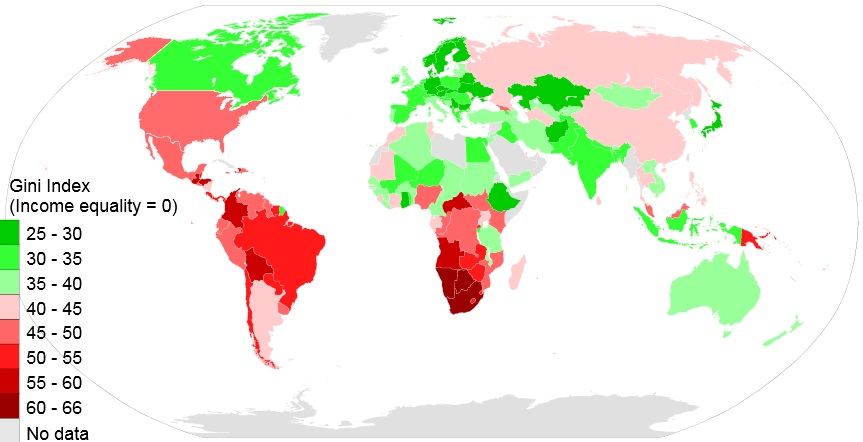
The Gini Coefficient is a measure of statistical dispersion developed by the Italian statistician and sociologist Corrado Gini and published in 1912. It measures the inequality among values of a frequency distribution, for example levels of income. A Gini Coefficient of zero expresses perfect equality, where all values are the same e.g. where everyone has an exactly equal income; while a Gini coefficient of 1 expresses maximal inequality among values e.g. where only one person has all the income. Some Gini Indices are expressed as percentages, as in the chart below:

Looking at a select few countries representative of the global economy, the following picture emerges:

It is interesting to note that out of the BRICS countries in the above graph, South Africa demonstrates the highest inequality of incomes, perhaps a reflection of its largely natural resource based economy (gold and diamonds), which has traditionally been developed by a rich white minority during the long years of apartheid.
Brazil too has a long history of military juntas which allowed a class of the super-rich with immense land holdings to flourish. It is only recently, that concerns of the poor have moved centrestage in Brazilian politics, and with the re-election of President Rousseff, are likely to remain there.
The growing disparity in China is indeed a surprise, especially because it is the last surviving communist regime of any consequence in the world. Perhaps the unnaturally rapid urbanisation and industrialisation in a traditionally agrarian society has allowed individual entrepreneurs to accumulate immense fortunes in a relatively short period of time.
The majority of the countries in the world have a Gini coefficient between 0.3 and 0.4. In the case of developing countries like India and Egypt, it is a reflection of the growing middle class post-globalisation; while in the case of USA and UK, it is a testament to their relatively secure health and income safety nets, which prevent extreme deprivation and hardship in the population.
News just in: A Credit Suisse Report says that disparity is growing rapidly in India, with the top 10% now holding 74% of the country’s total wealth, while the bottom 10% hold just 0.2%. The share of the top 1% (nearly half the country’s wealth) has always been lower than the share of the global 1%, but is now growing faster than the rest of the world. Yet Indians make up nearly 20% of the world’s poorest 10%!
Not surprisingly, Sweden repeatedly tops the charts for both highest Human Development and lowest disparity, clearly demonstrating the inverse relationship between disparity and human well-being.
Oxfam recommends that governments wishing to reduce the income disparity in their countries as a means of tackling poverty should consider:
- Cracking down on financial secrecy and tax dodging
- Redistributive transfers and strengthening of social protection schemes
- Investment in universal access to healthcare and education
- Progressive taxation
- Strengthening wage floors and worker rights
- Removing the barriers to equal rights and opportunities for women
Going by the experience and the professed policies of the new government in India, is any of this likely to happen soon? I think not.
Maybe after 5 years, the most tangible legacy of this government will be an India with a higher Gini coefficient.
And that may get the voters rethinking the promised ‘good times’…
 The recently published Social Progress Index Report made big news in India, because it put India lower than both Nepal and Bangladesh in its rankings. The ruling rightist Government (which worships at the altar of S&P, McKinsey and Moody’s) dismissed it as yet another leftist conspiracy – just as they dismiss all critics from Amartya Sen to Greenpeace – not realising that the report comes from the pens of globalization experts and management gurus like Michael E Porter.
 The Social Progress Report makes it a point to disassociate itself from prevalent economic indicators like GDP, pointing out that the top ranker on this Index (New Zealand) has a GDP practically half that of the world’s largest economy, the USA, yet outranks it by 15 places.
 The overall findings of the Social Progress Report 2015 are best encapsulated in this map:
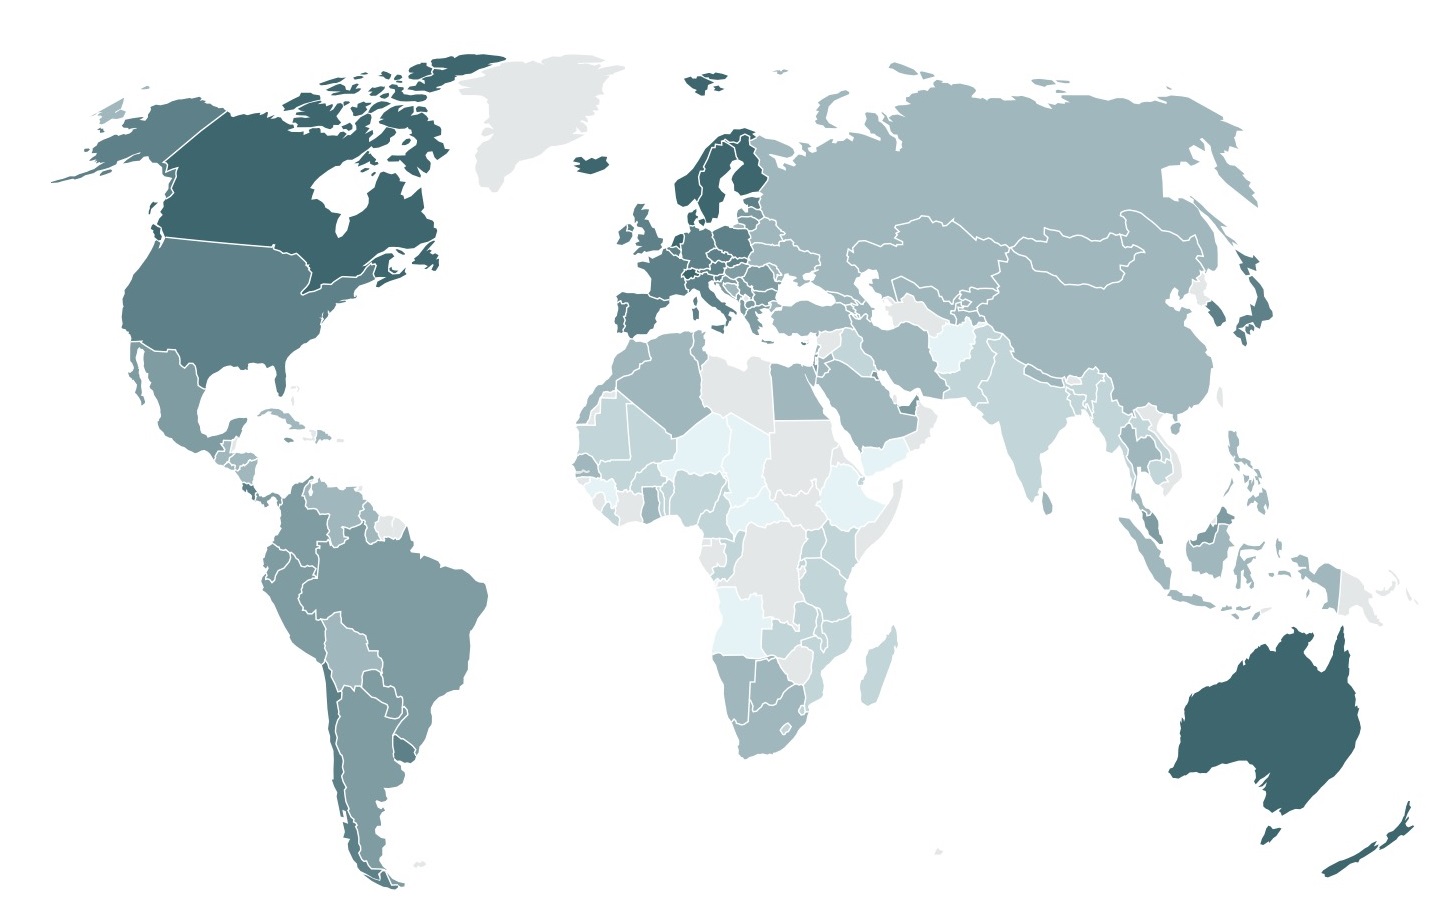 The beauty of the Social Progress Index is that it is interactive, and you can immediately see the impact of any indicator by adding a component and watching the colours change. I tried it for each of the components, one by one, and read at a glance the signals for India, especially those where it faded from pale to paler jade, to almost white… and the real areas of concern were: