 The recently published Social Progress Index Report made big news in India, because it put India lower than both Nepal and Bangladesh in its rankings. The ruling rightist Government (which worships at the altar of S&P, McKinsey and Moody’s) dismissed it as yet another leftist conspiracy – just as they dismiss all critics from Amartya Sen to Greenpeace – not realising that the report comes from the pens of globalization experts and management gurus like Michael E Porter.
The Report defines Social Progress as “… the capacity of a society to meet the basic human needs of its citizens, establish the building blocks that allow citizens and communities to enhance and sustain the quality of their lives, and create the conditions for all individuals to reach their full potential.”
Under these 3 broad categories, the Social Progress Index measured the following indicators for 132 countries:
 The Social Progress Report makes it a point to disassociate itself from prevalent economic indicators like GDP, pointing out that the top ranker on this Index (New Zealand) has a GDP practically half that of the world’s largest economy, the USA, yet outranks it by 15 places.
The following graph is very interesting (especially to the BRICS Countries, where India again, sadly, brings up the rear…):
 The overall findings of the Social Progress Report 2015 are best encapsulated in this map:
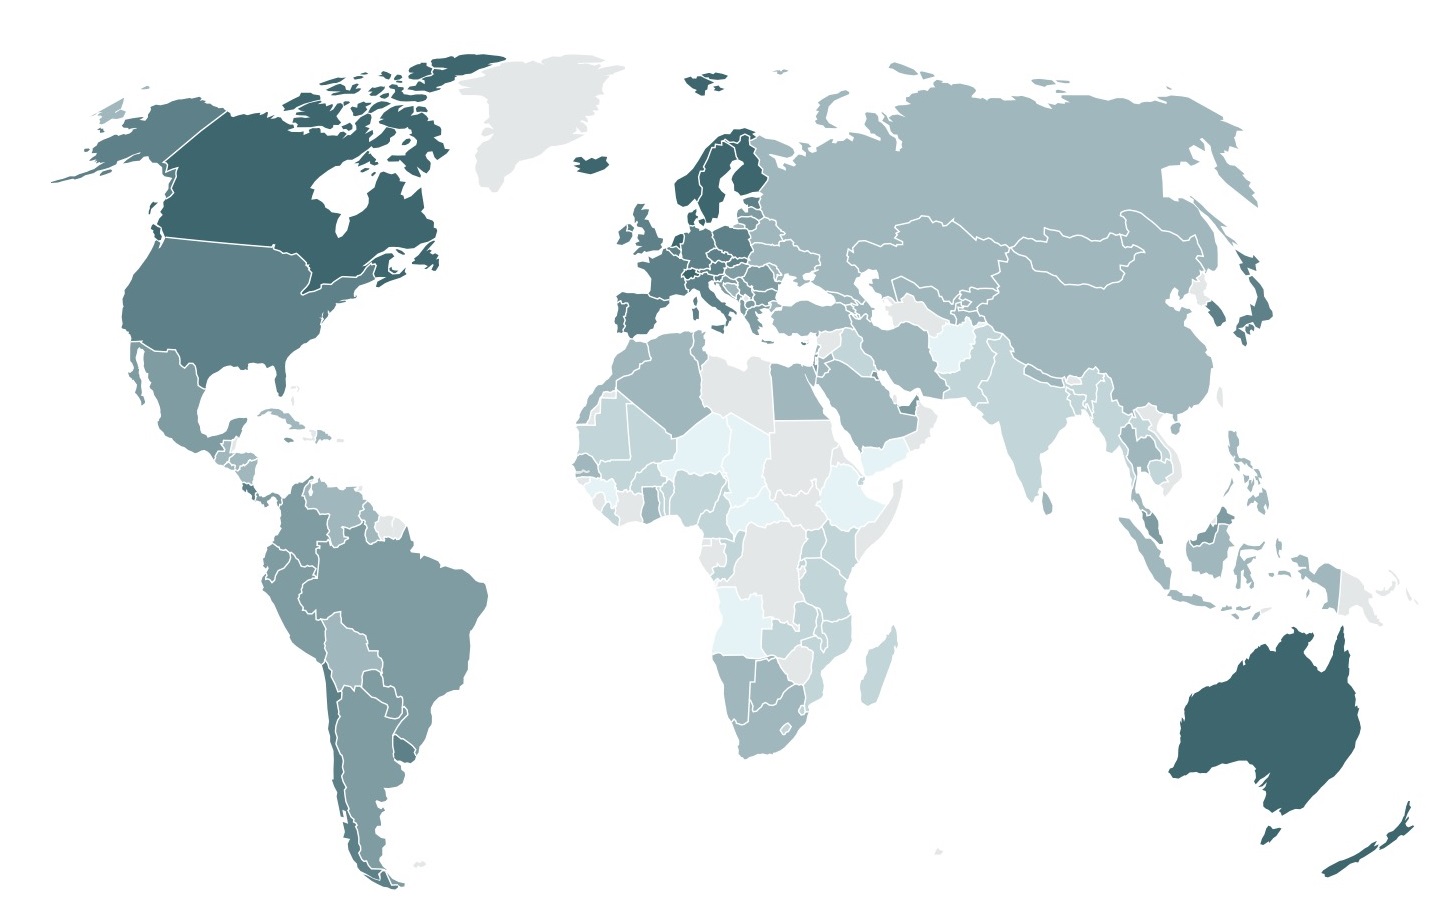 The beauty of the Social Progress Index is that it is interactive, and you can immediately see the impact of any indicator by adding a component and watching the colours change. I tried it for each of the components, one by one, and read at a glance the signals for India, especially those where it faded from pale to paler jade, to almost white… and the real areas of concern were:
- Availability of Water
- Availability of affordable housing
- Deterioration of the environment
- Inequality in the attainment of education
- Average years spent in school by the female half of the population
- Years of tertiary education
- Access to advanced education
- Religious intolerance
- Discrimination and violence against minorities – religious, ethnic, sexual preferences
Of course it would not be fair to put the blame on (or give the credit to, for that matter) a government which has been in office for less than a year. However, if development is directed growth, and progress the distance covered in that direction, then it is the direction which may need to change – especially for a government which came to power on the promise of ‘development for all’…
Or else, the next 4 years will see increasing discontent in civil society, more violence from the disgruntled, more Public Interest Litigation in the courts, more protests, and more raucousness in Parliament.
Then how will the dream of smart cities and industrial corridors be achieved?

Leave a comment